
Cockpit
Configuration
The programming of![]() is simple, intuitive and guided by dedicated tools. The configuration of device networks, graphic pages, data logs, trend charts and customised reports is very simple and requires no special expertise in information technology.
is simple, intuitive and guided by dedicated tools. The configuration of device networks, graphic pages, data logs, trend charts and customised reports is very simple and requires no special expertise in information technology.
Languages
![]() is available in a variety of languages: English, Italian, Spanish, French, Polish and Russian. Other languages can be added to meet special needs.
is available in a variety of languages: English, Italian, Spanish, French, Polish and Russian. Other languages can be added to meet special needs.
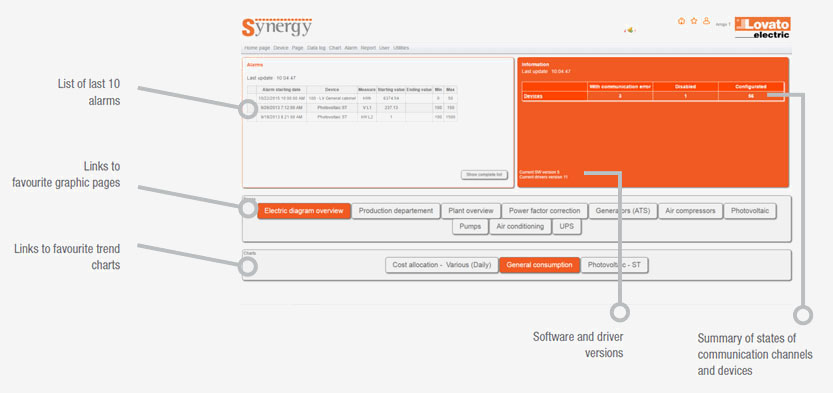
Home page of Synergy
The![]() home page summarises key diagnostic information and permits immediate verification of the state of the system.
home page summarises key diagnostic information and permits immediate verification of the state of the system.
Access levels
![]() permits access by a large number of users at three different privilege levels:
permits access by a large number of users at three different privilege levels:

Admin
complete access to all functionalities

Power user
can view only the devices defined by admin, creates and modifies pages, reports and graphs, exports and modifies device parameters

User
can view only the devices and pages defined by admin
Communication networks and channels
![]() interfaces with LOVATO Electric or third party products (Third party products having Modbus communication protocol). The software is able to simultaneously manage various communication channels (different TCP/IP addresses, RS232, RS485 and Ethernet communication ports), each independently configured (e.g. for protocol and speed).
interfaces with LOVATO Electric or third party products (Third party products having Modbus communication protocol). The software is able to simultaneously manage various communication channels (different TCP/IP addresses, RS232, RS485 and Ethernet communication ports), each independently configured (e.g. for protocol and speed).
In addition to physical connections in cabled networks, ![]() can also connect to analogue and GSM/GPRS modems. Communications are handled by the Modbus RTU, Modbus ASCII and Modbus TCP/IP protocols.
can also connect to analogue and GSM/GPRS modems. Communications are handled by the Modbus RTU, Modbus ASCII and Modbus TCP/IP protocols.
LOVATO Electric products connected directly to an Ethernet network can also work with dynamic TCP/IP addresses, permitting the use of a single static IP address for the server.
Management of interfaced products
The control menu includes: the principal information about the monitored equipment, communications with the software and the most recent readings. The menu allows users to edit the internal parameters of the various devices, save them to hard disk and re-load them for quick copy of configurations to other devices.
To optimise data traffic on communication networks, ![]() cyclically acquires only the data needed for the Data Logs and other data required by the active graphic page.
cyclically acquires only the data needed for the Data Logs and other data required by the active graphic page.
Synergy has 5 main components.
Pages

Monitoring pages contain the dynamic objects of ![]() (indicators, counters, control buttons, etc.) and customisable static images, to create overviews of the plant, synoptic/topographic panels and direct inputs for the equipment used. All energy measurements and control are thus directly at your fingertips.
(indicators, counters, control buttons, etc.) and customisable static images, to create overviews of the plant, synoptic/topographic panels and direct inputs for the equipment used. All energy measurements and control are thus directly at your fingertips.
Data Log
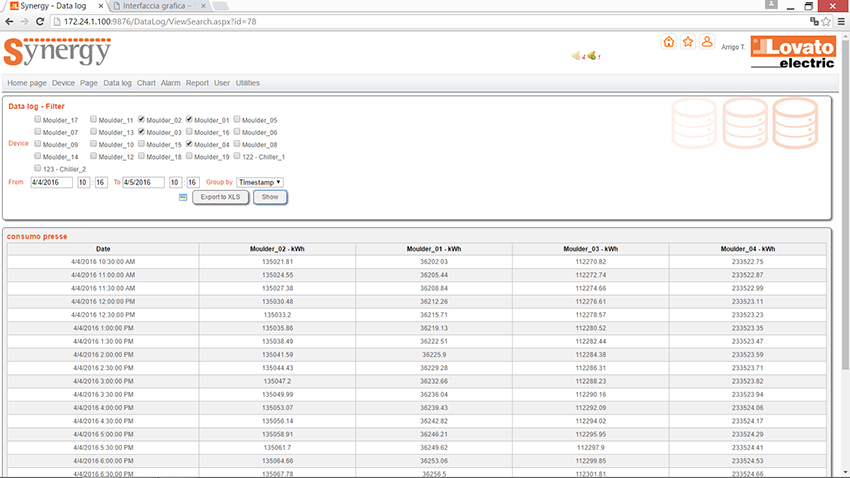
![]() lets you save data from field devices to an unlimited number of Data Logs, each fully configurable and customisable.
lets you save data from field devices to an unlimited number of Data Logs, each fully configurable and customisable.
The Data Logs can aggregate data per line, department/area or sampling period (at intervals from 60’ to 5’’). You can export the Data Logs in Excel or text format at any time, or schedule such operations automatically on fixed periods (day/week/year).
You can use the Data Logs off-line with devices which can be equipped with memory expansions (EXM10 30 or EXP10 30) so as to record the information directly.
Trend charts
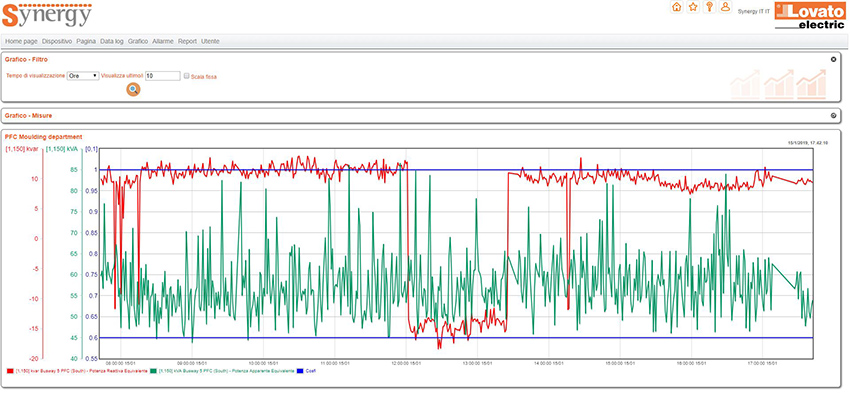
Data saved to the Data Logs can also be displayed in graphic form.
Chart period, chart type (lines, bars, dots, candle sticks), colours and scale can be changed quickly and easily. Attractive charts can be created to suit specific analysis requirements.
Alarms

When the limits set by the user or the various parameters are exceeded,![]() records the anomaly and displays it in the software’s header. The home page always displays the last 10 alarms, while the alarms menu displays their details and allows you to hide them.
records the anomaly and displays it in the software’s header. The home page always displays the last 10 alarms, while the alarms menu displays their details and allows you to hide them.
Each Data Log can be associated with one or more alarms. An upper and lower limit, calendar (for enabling/disabling the alarm), display in trend charts and automatic e-mail notification options can be set for each alarm.
Report

Reports let you process data collected from Data Logs and highlight significant values for all measured quantities (minimum, mean, maximum and differential values) using pre-set time bands (hours, days and months).
Reports can be displayed graphically (pie chart or histogram), with manual/automatic export by day, month or year in Excel or text format. The exported data can be saved to hard disk or transmitted by e-mail or FTP.